How to build your personal infrastructure for data collection and visualization
Use Grafana, PostgreSQL, Mosquitto and Platypush to collect data points on your infrastructure and be the real owner of your own data.
A smart home can generate and collect data. Lots of data. And there are currently a few outstanding issues with home-generated data:
-
Fragmentation. You probably have your home weather station, your own motion detectors, security cameras, gas and smoke detectors, body sensors, GPS and fit trackers and smart plugs around. It’s quite likely that most of these devices generates data, and that such data will in most of the cases be only accessible through a proprietary app or web service, and that any integration with other services, or any room for tinkering and automation purposes, will mostly depend on the benevolence of the developer or business in building third-party interfaces for such data. In this article, we’ll explore how, thanks to open source solutions like platypush, Grafana and Mosquitto, it’s possible to overcome the fragmentation issue and “glue” together data sources that wouldn’t otherwise be able to communicate nor share data.
-
Ability to query. Most of the hardware and data geeks out there won’t settle with the ability to access their data through a gauge in an app or a timeline graph. Many of us want the ability to explore our own generated data in a structured way, preferably through SQL, or any query language, and we demand tailor-made dashboards to explore our data, not dumb mobile apps. The ability to generate custom monthly reports of our fit activities, query the countries where we’ve been in a certain range of time, or how much time we spent indoor in the past three months, or how many times the smoke detectors in our guest room went above threshold in the past week, is, for many of us, priceless, and often neglected by hardware and software makers. In this article we’ll explore how to leverage an open-source relational database (PostgreSQL in this example) and some elementary data pipelines to dispatch and store your data on your private computers, ready to be queried or visualized however you like.
-
Privacy. Many of the solutions or services I’ve mentioned in the previous examples come with their cloud-based infrastructure to store user data. While storing your data on somebody else’s computers saves you the time and disk space required to invest in your local solution, it also comes with all the concerns related to — ehm — storing your data on somebody else’s computer. That somebody else can decide if and how you can access your data, can decide to sell your data for profit, or can be hacked in a way or another. This can be especially worrisome if we’re talking data about your own body, location or house environment. A house-hosted data infrastructure bypasses the issue with third-party ownership of your data.
This article will analyze the building blocks to set up your data infrastructure and build automation on it. We’ll see how to set up data collection and monitoring for a few use cases (temperature, humidity, gas, phone location and fit data) and how to build automation triggers based on such data.
Dependencies setup
First, you’ll need a RaspberryPi (or any similar clone) with Platypush. I assume that you’ve already got Platypush installed and configured. If not, please head to my my previous article on getting started with Platypush.
You’ll also need a relational database installed on your device. The example in this article will rely on PostgreSQL, but any relational database will do its job. To install and configure PostgreSQL on Raspbian and create a database named sensors:
[sudo] apt-get install postgresql libpq-dev postgresql-client
postgresql-client-common -y
[sudo] systemctl restart postgresql.service
[sudo] su postgres
createuser pi -P --interactive
psql -U pi
> create database sensors;
We’ll use the database to store the following information:
- System metrics
- Sensors data
- Smartphone and location data
- Fit data
You’ll also need a message queue broker running on your RaspberryPi to dispatch messages with new data reads — check this Instructables tutorial on how to get Mosquitto up and running on your RaspberryPi.
For some of the data measurements, we’ll also need an MQTT client to test messages over the configured queue — for example, to send measurements from a shell script. I like to use mqttcli for these purposes — it’s fast, lightweight and written in Go:
go get github.com/shirou/mqttcli
Finally, install Grafana as a web-based gateway to visualize your data:
[sudo] apt-get install grafana
[sudo] systemctl restart grafana
After starting the service head to http://your-pi:3000 and make sure that you see the Grafana splash screen — create a new admin user and you’re good to go for now.
Now that you’ve got all the fundamental pieces in place it’s time to set up your data collection pipeline and dashboard. Let’s start from setting up the tables and data storage logic on your database.
Database configuration
If you followed the instructions above then you’ll have a PostgreSQL instance running on your RaspberryPi, accessible through the user pi, and a sensors database created for the purpose. In this section, I’ll explain how to create the basic tables and the triggers to normalize the data. Keep in mind that your measurement tables might become quite large, depending on how much data you process and how often you process it. It’s relatively important, to keep database size under control and to make queries efficient, to provide normalized tables structures enforced by triggers. I’ve prepared the following provisioning script for my purposes:
-- Temporary sensors table where we store the raw
-- measurements as received on the message queue

drop table if exists tmp_sensors cascade;
create table tmp_sensors(
    id          serial not null,
    host        varchar(64) not null,
    metric      varchar(255) not null,
    data        double precision,
    created_at  timestamp with time zone default CURRENT_TIMESTAMP,
    primary key(id)
);

-- Table to store the hosts associated to the data points

drop table if exists sensor_host cascade;
create table sensor_host(
    id          serial not null,
    host        varchar(64) unique not null,
    primary key(id)
);

-- Table to store the metrics

drop table if exists sensor_metric cascade;
create table sensor_metric(
    id          serial not null,
    metric      varchar(255) unique not null,
    primary key(id)
);

-- Table to store the normalized data points

drop table if exists sensor_data cascade;
create table sensor_data(
    id          serial not null,
    host_id     integer not null,
    metric_id   integer not null,
    data        double precision,
    created_at  timestamp with time zone default CURRENT_TIMESTAMP,

    primary key(id),
    foreign key(host_id) references sensor_host(id),
    foreign key(metric_id) references sensor_metric(id)
);

-- Define a stored procedure that normalizes new rows on tmp_sensors
-- by either creating or returning the associated host_id and metric_id,
-- creating a normalized representation of the row on sensor_data and
-- delete the original raw entry on tmp_sensors.

create or replace function sync_sensors_data()
    returns trigger as
$$
begin
    insert into sensor_host(host) values(new.host)
        on conflict do nothing;

    insert into sensor_metric(metric) values(new.metric)
        on conflict do nothing;

    insert into sensor_data(host_id, metric_id, data) values(
        (select id from sensor_host where host = new.host),
        (select id from sensor_metric where metric = new.metric),
        new.data
    );

    delete from tmp_sensors where id = new.id;
    return new;
end;
$$
language 'plpgsql';

-- Create a trigger that invokes the store procedure defined above
-- after a row is inserted on tmp_sensors

drop trigger if exists on_sensor_data_insert on tmp_sensors;

create trigger on_sensor_data_insert
    after insert on tmp_sensors
    for each row
    execute procedure sync_sensors_data();

create view public.vsensors AS
 select d.id AS data_id,
    h.host,
    m.metric,
    d.data,
    d.created_at
   from ((public.sensor_data d
     join public.sensor_host h ON ((d.host_id = h.id)))
     join public.sensor_metric m ON ((d.metric_id = m.id)));
The script above will keep the data on your database normalized and query-friendly even if the messages pushed on the message queue don’t care about which is the right numeric host_id or metric_id. Run it against your PostgreSQL instance:
psql -U pi < database_provisioning.sql
Now that you’ve got the tables ready it’s time to fill them with data. We’ll see a few examples of metrics collection, starting with system metrics.
System metrics
You may want to monitor the CPU, RAM or disk usage of your own RaspberryPi or any other host or virtual server you’ve got around, do things like setting up a dashboard to easily monitor your metrics or set up alerts in case something goes out of control.
First, create a script that checks the memory available on your system and sends the percentage of used memory on a message queue channel — we’ll store this script under ~/bin/send_mem_stats.sh for the purposes of this tutorial:
#!/bin/bash

total=$(free -m | head -2 | tail -1 | awk '{print $2}')
avail=$(free -m | head -2 | tail -1 | awk '{print $7}')
let used=$total-$avail

export MQTT_HOST=your-mqtt-server
export MQTT_PORT=1883

$HOME/go/bin/mqttcli pub -t "sensors/$(hostname)/memory" -m $used
And schedule it to run every e.g. 5 minutes in your crontab:
*/5 * * * * /bin/bash /home/pi/bin/send_mem_stats.sh
Similar scripts can be made also for other system stats, for example to monitor the root disk usage:
#!/bin/bash

usage=$(df -h | egrep '/$' | awk '{print $5}' | tr -d % | awk '{printf "%.2f", ($0/100)}')

export MQTT_HOST=your-mqtt-server
export MQTT_PORT=1883

$HOME/go/bin/mqttcli pub -t "sensors/$(hostname)/disk_root" -m $usage
Alternatively, you can also write the logic for sending system data points directly in Platypush -
e.g. using the system
plugin - and that will be executed while the service is running, so you won't need the mqttcli dependency:
from datetime import datetime

from platypush.config import Config
from platypush.cron import cron
from platypush.utils import run


@cron('*/5 * * * *')
def send_memory_stats(**context):
    mem = run('system.mem_virtual')
    run('mqtt.publish', host='your-mqtt-server', port=1883,
        topic=f'sensors/{Config.get("device_id")}/memory',
        msg=mem['percent'])
You can extend this pattern to any sensor data you want to send over the queue.
Once scheduled these jobs will start pushing data to your message queue, on the configured topic (in the examples above respectively to sensors/<hostname>/memory and sensors/<hostname>/disk_root) at regular intervals.
It’s now time to set up Platypush to listen on those channels and whenever a new message comes in store it in the database you have provisioned. Add the following configuration to your ~/.config/platypush/config.yaml file:
backend.mqtt:
    host: your-mqtt-server
    port: 1883

    # Configure platypush to listen for new messages on these topics
    listeners:
        - host: your-mqtt-server
          topics:
              - sensors/host1/disk_root
              - sensors/host2/disk_root
              - sensors/host1/memory
              - sensors/host2/memory
And create an event hook (e.g. under ~/.config/platypush/scripts/mqtt.py) that stores the messages
received on some specified channels to your database:
from platypush.event.hook import hook
from platypush.utils import run

from platypush.message.event.mqtt import MQTTMessageEvent

db_engine = 'postgresql+pg8000://pi:your-password@localhost/sensors'


@hook(MQTTMessageEvent)
def on_mqtt_message(event, **context):
    if not event.topic.startswith('sensors/'):
        return

    (prefix, host, metric) = event.topic.split('/')
    run('db.insert',
        engine=db_engine,
        table='tmp_sensors',
        records=[{
            'host': host,
            'metric': metric,
            'data': event.msg,
        }]
    )
By inserting the data into tmp_sensors we make sure that the triggers that we previously declared on
the database will be executed and data will be normalized.
Start Platypush, and if everything went smooth you’ll soon see your sensor_data table getting populated with memory and disk usage stats.
Sensors data
Commercial weather stations, air quality solutions and presence detectors can be relatively expensive, and relatively limited when it comes to opening up their data, but by using the ingredients we’ve talked about so far it’s relatively easy to set up your network of sensors around the house and get them to collect data on your existing data infrastructure. Let’s consider for the purposes of this post an example that collects temperature and humidity measurements from some sensors around the house. You’ve got mainly two options when it comes to set up analog sensors on a RaspberryPi:
-
Option 1: Use an analog microprocessor (like Arduino or ESP8266) connected to your RaspberryPi over USB and configure platypush to read analogue measurements over serial port. The RaspberryPi is an amazing piece of technology but it doesn’t come with a native ADC converter. That means that many simple analog sensors available on the market that map different environment values to different voltage values won’t work on a RaspberryPi unless you use a device in between that can actually read the analog measurements and push them to the RaspberryPi over serial interface. For my purposes I often use Arduino Nano clones, as they’re usually quite cheap, but any device that can communicate over USB/serial port should do its job. You can find cheap but accurate temperature and humidity sensors on the internet, like the TMP36, DHT11 and AM2320, that can easily be set up to communicate with your Arduino/ESP device. All you need is to make sure that your Arduino/ESP device spits a valid JSON message back on the serial port whenever it performs a new measurement (e.g.
{"temperature": 21.0, "humidity":
  45.0}
), so Platypush can easily understand when there is a change in value for a certain measurement. -
Option 2: Devices like the ESP8266 already come with a Wi-Fi module and can directly send message over MQTT through small MicroPython libraries like
umqttsimple(check out this tutorial for ESP8266+MQTT setup). In this case you won’t need a serial connection, and you can directly send data from your sensor to your MQTT server from the device. -
Option 3: Use a breakout sensor (like the BMP280, SHT31 or HTU21D-F) that communicates over I2C/SPI that you can plug directly on the RaspberryPi. If you go for this solution then you won’t need another microprocessor to deal with the ADC conversion, but you’ll also have to make sure that these devices come with a Python library and they’re supported in Platypush (feel free to open an issue or send a pull request if that’s not the case).
Let’s briefly analyze an example of the option 1 implementation. Let’s suppose that you have an Arduino with a connected DHT11 temperature and humidity sensor on the PIN 7. You can prepare a sketch that looks like this to send new measurements over USB to the RaspberryPi in JSON format:
#include <Arduino.h>
#include <dht.h>

#define   DHT11_PIN   7
dht       DHT;

void setup() {
  Serial.begin(9600);
}

void loop() {
  int ret = DHT.read11(DHT11_PIN);

  if (ret < -1) {
    delay(1000);
    return;
  }

  Serial.print("{\"temperature\":");
  Serial.print(DHT.temperature);
  Serial.print(", \"humidity\":");
  Serial.print(DHT.humidity);
  Serial.println("}");
  delay(1000);
}
Install the Platypush serial plugin dependencies:
[sudo] pip install 'platypush[serial]'
Then you can add the following lines into the ~/.config/platypush/config.yaml file of the RaspberryPi that has the
sensors connected to forward new measurements to the message queue, and store them on your local database. The example
also shows how to tweak polling period, tolerance and thresholds:
# Enable the serial plugin and specify
# the path to your Arduino/Esp* device
serial:
    device: /dev/ttyUSB0

# Enable the serial sensor backend to
# listen for changes in the metrics
backend.sensor.serial:
    # How often we should poll for new data
    poll_seconds: 5.0

    # Which sensors should be enabled. These are
    # the keys in the JSON you'll be sending over serial
    enabled_sensors:
        - temperature
        - humidity

    # Specify the tolerance for the metrics. A new
    # measurement event will be triggered only if
    # the absolute value difference between the value in
    # the latest event and the value in the current
    # measurement is higher than these thresholds.
    # If no tolerance value is set for a specific metric
    # then new events will be triggered whenever we've
    # got new values, as long as they're different from
    # the previous, no matter the difference.
    tolerance:
        temperature: 0.25
        humidity: 0.5

    # Specify optional thresholds for the metrics. A new
    # sensor above/below threshold event will be triggered
    # when the value of that metric goes above/below the
    # configured threshold.
    thresholds:
        humidity: 70.0

        # You can also specify multiple thresholds values for a metric
        temperature:
            - 20.0
            - 25.0
            - 30.0
backend.sensor.serial (and, in
general, any sensor backend) will trigger
a SensorDataChangeEvent
when new sensor data is available, and
SensorDataBelowThresholdEvent /
SensorDataAboveThresholdEvent
respectively when the new sensor data is respectively below or above one of the configured threshold.
We can now configure an event hook to send new sensor data to MQTT to be stored on the database by dropping another
script into ~/.config/platypush/scripts:
from platypush.config import Config
from platypush.event.hook import hook
from platypush.utils import run

from platypush.message.event.sensor import SensorDataChangeEvent

@hook(SensorDataChangeEvent)
def on_sensor_data(event, **context):
    hostname = Config.get('device_id')

    for metric in ['temperature', 'humidity']:
      if 'temperature' in event.data:
        run('mqtt.publish', topic=f'sensors/{hostname}/{metric}',
            host='your-mqtt-server', port=1883, msg=event.data[metric])
Just remember to add sensors/your-rpi/temperature, sensors/your-rpi/humidity and any other MQTT topic that you want
to monitor to the list of topics watched by backend.mqtt on the MQTT/database host.
You can also trigger actions when some sensor data goes above or below a configured threshold - for instance, turn on/off the lights if the luminosity sensor goes below/above threshold, or turn on/off the fan if the temperature sensor goes above/below a certain threshold:
from platypush.event.hook import hook
from platypush.utils import run

from platypush.message.event.sensor import \
  SensorDataAboveThresholdEvent, SensorDataBelowThresholdEvent

@hook(SensorDataAboveThresholdEvent)
def on_sensor_data(event, **context):
  if 'luminosity' in event.data:
    run('light.hue.off')

  if 'temperature' in event.data:
    run('switch.tplink.on', device='Fan')

@hook(SensorDataBelowThresholdEvent)
def on_sensor_data(event, **context):
  if 'luminosity' in event.data:
    run('light.hue.on')

  if 'temperature' in event.data:
    run('switch.tplink.off', device='Fan')
This logic isn't limited to sensor events sent over a serial interface like an Arduino or ESP8266. If you have sensors that communicate over e.g. Zigbee, Z-Wave or Bluetooth, you can also configure them in Platypush through the respective backends and react to their events.
Smartphone and location data
Our smartphones also generate a lot of data that would be nice to track on our new data infrastructure and automate to make our lives easier. We’ll show in this example how to leverage Tasker, Pushbullet and AutoLocation on your Android device to regularly check your location, store it on your local database (so you can turn off the creepy Google’s location history — sorry, Google) and implement smart rules such as turning on lighting and heating and saying a welcome message when you arrive home.
Let’s first see how to store your phone location data to your local database.
- Install the Pushbullet, Tasker and AutoLocation apps on your phone.
- Head to your Pushbullet account settings page and create a new access token.
- Enable the Pushbullet backend on the platypush installation on your database host. Lines to add to your
config.yaml:
backend.pushbullet:
    token: your-token
    device: platypush
- Add a table to your database to store location data:
CREATE TABLE location_history (
    id serial NOT NULL,
    latitude double precision,
    longitude double precision,
    altitude double precision,
    created_at timestamp with time zone DEFAULT CURRENT_TIMESTAMP,

    primary key(id)
);
- Create an event hook that listens for specifically formatted Pushbullet notes (e.g
. LATLNG#7.8712,57.3123) that contains lat/long information and stores them on your PostgreSQL database:
from platypush.event.hook import hook
from platypush.utils import run

from platypush.message.event.pushbullet import PushbulletEvent

db_engine = 'postgresql+pg8000://pi:your-password@localhost/sensors'

@hook(PushbulletEvent)
def on_push_data(event, **context):
  if event.body.startswith('LATLNG'):
    run('db.insert', engine=db_engine, table='location_history',
        records=[{
          'latitude': event.body[len('LATLNG#'):].split(',')[0],
          'longitude': event.body[len('LATLNG#'):].split(',')[1],
        }]
    )
You can also configure Tasker to use a 3rd-party app to send messages directly to MQTT (like Join or MQTT Client) so you don't have to stuff data into Pushbullet notes, but for the purpose of this example we'll analyze the Pushbullet way because it's easier to set up.
- Create a Tasker task that runs every 10 minutes (or 5, or 20, or however often you like) to update your location by sending a Pushbullet note to your Platypush virtual device:


After saving the Tasker profile your smartphone will start sending its location data at regular intervals to Pushbullet, your RaspberryPi will intercept those notifications and store the data on your local database. Time to ditch third-party location trackers for good!
How about running custom actions when you enter or exit your home area? Let’s create a Tasker profile that, based on AutoLocation lat/long data, detects when you enter or exit a certain area.

The task will simply send a Pushbullet note to your Platypush virtual device that contains HOME#1 (you entered your
home area) or HOME#0 (you exited your home area).


Add an event hook to intercept the notification and run your custom logic:
from platypush.context import get_plugin
from platypush.event.hook import hook

from platypush.message.event.pushbullet import PushbulletEvent

@hook(PushbulletEvent)
def on_home_push_data(event, **context):
  if not event.body.startswith('HOME#'):
    return

  # Initialize the plugins
  # Note that get_plugin('plugin').method() and
  # run('plugin.method') can be used interexchangably
  variable = get_plugin('variable')
  lights = get_plugin('light.hue')
  music = get_plugin('music.mpd')
  tts = get_plugin('tts')

  # Get the AT_HOME status
  at_home = int(event.body.split('#')[1])

  # Get the previous AT_HOME status
  prev_at_home = int(variable.get('AT_HOME').get('AT_HOME', 0))

  if at_home and not prev_at_home:
    # Example: turn on the lights, start playing the music and
    # say a welcome message
    lights.on()
    tts.say(text='Welcome home')
    music.play()
  elif not at_home and prev_at_home:
    # Turn off the lights and stop the music
    lights.off()
    music.stop()

  # Store the new AT_HOME status
  variable.set(AT_HOME=at_home)
With the simple ingredients shown so far, it is relatively straightforward to connect events on your phone to your smart home infrastructure, as long as you’ve got a Tasker plugin on your smartphone for achieving what you want to do.
Fit data
The explosion of smartwatches, fit trackers, body sensors and smart fit algorithms running on our phones in the last years has opened the gates to an authentic revolution for health and fit technologies. However, such a revolution is still failing to reach its full potential because of the fragmentation of the market and the limited possibilities when it comes to visualize and query data. Most of the health and fit solutions come with their walled garden app: you can only access the data using the app provided by the developer, and you can only use that app to access the data generated by your specific sensors. The lack of integration between solutions has turned what could be a revolution in the way we measure the data generated by our bodies in cool pieces of tech that we like to show to friends without much practical utility. In the last years, some steps forward have been done by Google Fit; more and more products nowadays can synchronize their data to Google Fit (and my advice is to steer clear of those who don’t: they’re nothing more but shiny toys with no practical utility). However, although Google Fit allows you to have a single view on your body data even if the data points are collected by different sensors, it’s still very limited when it comes to providing you with a powerful way to query, compare and visualize your data. The web service has been killed a while ago, and that means that the only way to access your data is through the (frankly very limited) mobile app. And you’ve got no way to perform more advanced queries, such as comparisons of data between different periods, finding the day during the month when you’ve walked or slept the most, or even just visualizing the data on a computer unless you make your own program leveraging the Fit API.
Luckily, Platypush comes with a handy Google Fit backend and plugin, and you can leverage them to easily build your visualization, automation and queriable fit database.
- Prepare the fit tables on your database. Again, we’ll leverage a trigger to take care of the normalization:
--
-- tmp_fit_data table setup
--

drop sequence if exists tmp_fit_data_seq cascade;
create sequence tmp_fit_data_seq;

drop table if exists tmp_fit_data cascade;
create table tmp_fit_data(
    id                integer not null default nextval('tmp_fit_data_seq'),
    username          varchar(255) not null default 'me',
    data_source       varchar(1024) not null,
    orig_data_source  varchar(1024),
    data_type         varchar(255) not null,
    value             float,
    json_value        jsonb,
    start_time        timestamp with time zone not null,
    end_time          timestamp with time zone not null,
    primary key(id)
);

alter sequence tmp_fit_data_seq owned by tmp_fit_data.id;

--
-- fit_user table setup
--

drop sequence if exists fit_user_seq cascade;
create sequence fit_user_seq;

drop table if exists fit_user cascade;
create table fit_user(
    id                  integer not null default nextval('fit_user_seq'),
    name                varchar(255) unique not null,
    primary key(id)
);

alter sequence fit_user_seq owned by fit_user.id;

--
-- fit_data_source table setup
--

drop sequence if exists fit_data_source_seq cascade;
create sequence fit_data_source_seq;

drop table if exists fit_data_source cascade;
create table fit_data_source(
    id                  integer not null default nextval('fit_data_source_seq'),
    name                varchar(255) unique not null,
    primary key(id)
);

alter sequence fit_data_source_seq owned by fit_data_source.id;

--
-- fit_data_type table setup
--

drop sequence if exists fit_data_type_seq cascade;
create sequence fit_data_type_seq;

drop table if exists fit_data_type cascade;
create table fit_data_type(
    id                  integer not null default nextval('fit_data_type_seq'),
    name                varchar(255) unique not null,
    primary key(id)
);

alter sequence fit_data_type_seq owned by fit_data_type.id;

--
-- fit_data table setup
--

drop sequence if exists fit_data_seq cascade;
create sequence fit_data_seq;

drop table if exists fit_data cascade;
create table fit_data(
    id                   integer not null default nextval('fit_data_seq'),
    user_id              integer not null,
    data_source_id       integer not null,
    orig_data_source_id  integer,
    data_type_id         integer not null,
    value                float,
    json_value           jsonb,
    start_time           timestamp with time zone not null,
    end_time             timestamp with time zone not null,

    primary key(id),
    foreign key(user_id) references fit_user(id),
    foreign key(data_source_id) references fit_data_source(id),
    foreign key(orig_data_source_id) references fit_data_source(id),
    foreign key(data_type_id) references fit_data_type(id)
);

alter sequence fit_data_seq owned by fit_data.id;

--
-- Sync fit_data table trigger setup
--

create or replace function sync_fit_data()
    returns trigger as
$$
begin
    insert into fit_user(name) values(new.username)
        on conflict do nothing;

    insert into fit_data_source(name) values(new.data_source)
        on conflict do nothing;

    insert into fit_data_source(name) values(new.orig_data_source)
        on conflict do nothing;

    insert into fit_data_type(name) values(new.data_type)
        on conflict do nothing;

    insert into fit_data(user_id, data_source_id, orig_data_source_id, data_type_id, value, json_value, start_time, end_time) values(
        (select id from fit_user u where u.name = new.username),
        (select id from fit_data_source ds where ds.name = new.data_source),
        (select id from fit_data_source ds where ds.name = new.orig_data_source),
        (select id from fit_data_type dt where dt.name = new.data_type),
        new.value, new.json_value, new.start_time, new.end_time
    );

    delete from tmp_fit_data where id = new.id;
    return new;
end;
$$
language 'plpgsql';


drop trigger if exists on_tmp_fit_data_insert on tmp_fit_data;
create trigger on_tmp_fit_data_insert
    after insert on tmp_fit_data
    for each row
    execute procedure sync_fit_data();

--
-- vfit view definition

drop view if exists vfit;
create view vfit as
select d.id
     , u.name as username
     , ds.name as data_source
     , ods.name as orig_data_source
     , dt.name as data_type
     , value
     , json_value
     , start_time
     , end_time
from fit_data d
join fit_user u on d.user_id = u.id
join fit_data_source ds on d.data_source_id = ds.id
left join fit_data_source ods on d.orig_data_source_id = ods.id
join fit_data_type dt on d.data_type_id = dt.id;
- Head to the Google developers console and get your credentials JSON file:

- Run the following command to authorize platypush to access your Fit data:
python -m platypush.plugins.google.credentials \
    "https://www.googleapis.com/auth/fitness.activity.read
     https://www.googleapis.com/auth/fitness.body.read
     https://www.googleapis.com/auth/fitness.body_temperature.read
     https://www.googleapis.com/auth/fitness.location.read" \
    /path/to/your/credentials.json \
    --noauth_local_webserver
- With Platypush running, check the data sources that are available on your account:
curl -XPOST \
  -H "Authorization: Bearer $PP_TOKEN" \
  -H 'Content-Type: application/json' -d '
   {
     "type":"request",
     "action":"google.fit.get_data_sources"
   }' http://your-pi:8008/execute
- Take note of the
dataStreamIdattributes of the metrics that you want to monitor and add them to the configuration of the Google Fit backend:
backend.google.fit:
    poll_seconds: 1800
    data_sources:
        - derived:com.google.weight:com.google.android.gms:merge_weight
        - derived:com.google.calories.bmr:com.google.android.gms:merged
        - derived:com.google.distance.delta:com.google.android.gms:platform_distance_delta
        - derived:com.google.speed:com.google.android.gms:merge_speed
        - derived:com.google.step_count.delta:com.google.android.gms:merge_step_deltas
        - derived:com.google.heart_rate.bpm:com.google.android.gms:merge_heart_rate_bpm
        - derived:com.google.calories.expended:com.google.android.gms:from_activities
        - derived:com.google.calories.expended:com.google.android.gms:from_bmr
        - derived:com.google.calories.expended:com.google.android.gms:platform_calories_expended
        - derived:com.google.activity.segment:com.google.android.gms:platform_activity_segments
        - derived:com.google.activity.segment:com.google.android.gms:merge_activity_segments
        - derived:com.google.activity.segment:com.google.android.gms:session_activity_segment
        - derived:com.google.active_minutes:com.google.android.gms:merge_active_minutes
- Finally, create an event hook that inserts new data into your newly created tables:
import datetime
import json

from platypush.event.hook import hook
from platypush.utils import run
from platypush.message.event.google.fit import GoogleFitEvent

db_engine = 'postgresql+pg8000://pi:your-password@localhost/sensors'

@hook(GoogleFitEvent)
def on_home_push_data(event, **context):
  run('db.insert', engine=db_engine, table='tmp_fit_data',
      records=[{
        'username': event.user_id,
        'data_source': event.data_source_id,
        'orig_data_source': event.origin_data_source_id,
        'data_type': event.data_type,
        'value': event.values[0],
        'json_value': json.dumps(event.values),
        'start_time': datetime.datetime.fromtimestamp(event.start_time),
        'end_time': datetime.datetime.fromtimestamp(event.end_time),
      }]
  )
- Restart Platypush. You should soon start to see your fit data populating your tables.
Data visualization and automatic alerting
So now you’ve built your data pipeline to deliver system, sensor, mobile and fit data points to your local database and build automation on those events. But we all know that data collection is only half fun if we can’t visualize that data. Time to head to the Grafana dashboard we’ve installed and create some graphs!
You can install Grafana on Debian/Ubuntu/Raspbian/RaspberryPi OS by adding the Grafana repository to your apt sources:
wget -q -O - https://packages.grafana.com/gpg.key | sudo apt-key add -
echo "deb https://packages.grafana.com/oss/deb stable main" | sudo tee -a /etc/apt/sources.list.d/grafana.list
[sudo] apt-get update
[sudo] apt-get install -y grafana

# Enable and start the service
[sudo] systemctl enable grafana-server
[sudo] systemctl start grafana-server
On Arch Linux the grafana package is instead provided in the default repository.
Open http://your-pi-address:3000/ in your browser, create an admin user and add your database to the configuration as
a PostgreSQL source.
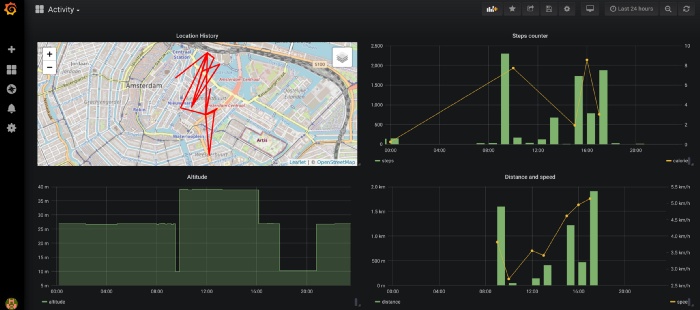
Creating dashboards and panels in Grafana is really straightforward. All you need is to specify the visualization type and the query that you want to run against your database. A simple panel that displays the steps walked per day and the active time would look like this:

Grafana also allows you to create alerts when some metrics go below/above a certain threshold or when there are no data points for a certain period of time. You can also connect such alerts back to platypush events by leveraging Platypush’s web hooks.
Let’s see for example how to configure Grafana to send a notification to a Platypush custom web hook that sends a Pushbullet notification to your mobile device when the measurements from one of your gas sensors go above a certain threshold:
- Add a web hook script:
from platypush.event.hook import hook
from platypush.utils import run
from platypush.message.event.http.hook import WebhookEvent

@hook(WebhookEvent, hook='gas_alert')
def on_gas_alert(event, **context):
  if event.state != 'ok':
    run('pushbullet.send_note', title=event.title,
        body='High concentration of gas detected!')
This configuration will create a dynamic web hook that can be accessed through http://your-pi:8008/hook/gas_alert.
- Go to your Grafana dashboard, click on “Alerting” (bell icon on the right) -> Notifications channels and add your web hook:

- Edit the panel that contains your gas sensor measurements, click on the bell icon and add an automatic alert whenever the value goes above a certain threshold:

You’ll receive a Pushbullet notification on your mobile device whenever there is an alert associated with your metric.
If you’ve read the article so far you should have all the ingredients in place to do anything you want with your own data. This article tries its best to show useful examples but isn’t intended to be an exhaustive guide to everything that you can do by connecting a database, a data pipeline and an event and automation engine. I hope that I have provided you with enough inputs to stimulate your creativity and build something new :)
Reactions
How to interact with this page
Webmentions
To interact via Webmentions, send an activity that references this URL from a platform that supports Webmentions, such as Lemmy, WordPress with Webmention plugins, or any IndieWeb-compatible site.
ActivityPub
- Follow @blog@platypush.tech on your ActivityPub platform (e.g. Mastodon, Misskey, Pleroma, Lemmy).
- Mention @blog@platypush.tech in a post to feature on the Guestbook.
- Search for this URL on your instance to find and interact with the post.
- Like, boost, quote, or reply to the post to feature your activity here.